A dashboard that explains every number

AI Dashboard Builder For Metrics Your Team Can Trust

Describe the decisions, source records, metric formulas, roles, and drill-downs your team needs. Playcode builds the dashboard and its database-backed workflow together, so you can verify definitions, freshness, access, retries, late data, and recovery before using the numbers to act.

No credit card required · No coding needed

Quick answer

What does an AI dashboard builder create?

An AI dashboard builder turns your records and operating questions into a custom app with metric cards, trends, filters, tables, and protected drill-downs. With Playcode, you define each formula, time window, source query, freshness rule, and access boundary, then build a database-backed dashboard your team can test, publish, and maintain.

1.1M+users
26M+projects
Since 2016

Used by people at

Counts registered accounts using corporate email domains from the companies above. Playcode is a self-serve product, not a contracted vendor to these brands.

From Business Question to Reconciled Dashboard

Build one trustworthy decision view before adding more charts or data sources

01

Write the Metric Contracts

Start with the decision each metric supports. For every card or chart, name the numerator, denominator, exclusions, grouping, time window, time zone, event timestamp, source records, and owner who can resolve a disagreement.

Define zero, null, missing, duplicate, canceled, and late-arriving records explicitly. A friendly label such as “active customers” is not a metric definition by itself.

Preview
AI Chat
Publish
I'm a realtor in Miami. I need a website to show my listings and get buyer leads.
4 Questions
2 / 4
What's the main style for your real estate site?
AModern & minimal with clean lines
BLuxury feel with large property photos
CProfessional & corporate
DI'll describe my own style below
Or type your own answer...
Skip
Next
Describe what you want to change...
Economy
Build Progress
4/6
Site layout & navigation
3s
Hero section with CTA
5s
Property listings grid
8s
Building contact form...
About page & bio
Footer & SEO meta
miami-homes.playcode.io
Miami Dream Homes
Your trusted partner in Miami real estate
Search by neighborhood...
Featured Listings
NEW
$1,250,000
Coral Gables Villa
4 bd|3 ba|2,400 sqft
OPEN
$890,000
Brickell Condo
2 bd|2 ba|1,200 sqft
Get in Touch
02

Build One Protected Query Path

Ask Playcode to model the source records, validate them on the server, and return cards, trends, tables, freshness, and drill-down rows from one authorized query contract. Protect the underlying records, not only the visible menu.

Use stable record IDs and query versions. Keep browser filters as inputs to the server rather than letting each chart invent its own calculation from a downloaded data set.

03

Reconcile, Publish, and Operate

Calculate a small fictional fixture by hand, compare every view with the server result, test late and duplicate records, then publish over HTTPS. Monitor query success, data freshness, reconciliation drift, and access failures with bounded logs.

Show stale, empty, null, loading, denied, and error states honestly. Define whether recovery means repairing one record, rebuilding a cached summary, or restoring the whole app to a saved point.

Your website is live!

https://
miami-homes.playcode.io
Site is secure - SSL certificate active
Or connect your domainmiami-dream-homes.com
Miami Dream Homes
Your trusted partner
Miami Dream Homes
Your trusted partner
Move from plausible charts to explainable decisions

Make Every Metric Traceable to Records and Rules

A dashboard is useful only when the team can explain why a number changed

A chart assembled around labels

  • “Active” and “resolved” mean different things across teams
  • Cards and tables silently use different filters or time zones
  • Missing values become zero and make trends look complete
  • A refresh timestamp changes even when the source query failed
  • Anyone with the page URL can inspect protected detail rows

A bounded dashboard contract

  • Every metric names its formula, window, time zone, source, and owner
  • Cards, trends, tables, and drill-downs share one server query contract
  • Null, duplicate, canceled, and late records have written treatment
  • Freshness reports the last successful data result and query version
  • Every summary and detail path enforces role and record scope on the server
A dependable first dashboard release

What Your Custom Dashboard Can Include

Start with the smallest view that answers one recurring operating question

01

Metric definitions beside the result

Document the formula, source records, exclusions, window, time zone, update owner, and query version for every visible metric.

02

Shared cards, charts, and tables

Return summaries and detail rows from one server-side query contract so the same filter cannot mean three different things.

03

Freshness and late-data states

Show when data last loaded successfully, which event time the result covers, and whether late records can still revise a closed period.

04

Permissioned drill-downs

Authorize the current workspace, role, team, record scope, and requested action before returning a metric, table, export, or individual row.

05

Null, duplicate, and conflict handling

Keep unknown values distinct from zero, deduplicate technical retries by stable identity, and surface conflicting or malformed source records for review.

06

Reconciliation and recovery

Compare controlled fixtures with query results, monitor drift and freshness, rebuild derived summaries safely, and distinguish record repair from whole-app restore.

A practical dashboard implementation guide

Build One Metric Set the Team Can Reconcile

Define the numbers, source records, query, access, freshness, tests, and recovery before polishing the visualization.

Before you build

Prerequisites

  • A written metric contract for every first-release number

    A label such as “open requests” hides decisions about status, exclusions, event time, window boundaries, time zone, duplicates, and missing values.

    Ready when: For each metric, you can state its numerator, denominator when applicable, inclusion and exclusion rules, grouping, window, time zone, source timestamp, owner, and what zero and null mean.

  • A bounded source-record model and controlled fixture

    The interface cannot make an undefined source trustworthy. Stable record identity, lifecycle, timestamps, ownership, and validation must exist before aggregation.

    Ready when: You have fictional records with stable IDs, statuses, event and ingestion timestamps, owners, versions, deliberate nulls, one duplicate retry, one canceled record, and one late arrival whose expected metrics are calculated by hand.

  • A role, record-scope, and export matrix

    A summary can reveal sensitive counts, while a drill-down or export can expose the underlying people, requests, prices, or notes. Sign-in alone is not authorization.

    Ready when: For signed out, two ordinary accounts, a team lead, and an administrator, the expected result is written for summary, filter, drill-down, row detail, export, metric-definition edit, and cache-refresh actions.

Implementation sequence

Do, observe, verify
  1. 01
    Playcode AI prompt and the dashboard definition screen or project documentation

    Turn each operating question into a metric definition

    Name the decision, metric label, numerator, denominator, exclusions, grouping, time window, time zone, event timestamp, source records, display format, query owner, and reconciliation owner. Define zero, null, duplicate, canceled, and late-arriving treatment.

    Expected result

    Every first-release number has a definition another operator can calculate from the same fictional records without looking at the dashboard implementation.

    Verify

    Give the fixture and metric contracts to a second reviewer and confirm their hand calculation matches the documented expected card, trend, and table values.

  2. 02
    Playcode project database and server create or import boundary

    Model and validate the source records

    Create stable record IDs, lifecycle fields, ownership, event and ingestion timestamps, time-zone context, versions, and a technical idempotency identity. Validate types, lengths, allowed transitions, relationships, and timestamp ranges on the server before the record can affect a metric.

    Expected result

    Accepted records have enough identity and time context to aggregate deterministically, while malformed, unauthorized, and repeated technical attempts cannot silently change the total.

    Verify

    Submit missing status, impossible timestamps, an unknown owner, an oversized field, a reused attempt identity, and an unauthorized team ID; inspect the durable record count and explicit rejection results.

  3. 03
    Server dashboard query and access layer

    Build one authorized query contract for every view

    Resolve the current actor and allowed record scope, validate filters and time zone, then compute cards, chart buckets, table rows, drill-down counts, last successful data time, covered-through event time, and query version from the same definition. Return null and stale states explicitly.

    Expected result

    Cards, trends, tables, and drill-downs agree for the same query, and changing a browser-only parameter cannot expand the actor’s authorized record scope.

    Verify

    Compare all view totals for the fixture, repeat the request with another account and manipulated team and date filters, and trace one card through its returned detail rows to the source IDs.

  4. 04
    Server query, scheduler or background job, and cache metadata

    Choose live queries or derived snapshots deliberately

    Use a live query for the bounded first release when it meets the response target. If volume makes that impractical, build a versioned summary with source-through time, calculation time, definition version, retry-safe rebuild, and an operator action that cannot expose broader records.

    Expected result

    The dashboard has a documented freshness and performance contract instead of an unexplained cache, and a failed rebuild leaves the last successful result visibly stale rather than falsely fresh.

    Verify

    Measure the representative query, force one rebuild failure, retry the same job identity, compare the snapshot with a direct source calculation, and confirm the displayed freshness time advances only after a successful result.

  5. 05
    Published HTTPS dashboard and protected operator runbook

    Publish, reconcile, monitor, and rehearse recovery

    Publish the app, run the controlled fixture through a private mobile-width browser and two accounts, and monitor query errors, duration, source-through time, stale age, reconciliation difference, and denied access with bounded request IDs. Rehearse record repair, summary rebuild, and the saved-point restore decision.

    Expected result

    The intended operator can make one verified decision, unauthorized users receive no protected values, failures are diagnosable without private payloads, and recovery does not default to moving all app data backward.

    Verify

    Complete the production smoke matrix, compare the published result with the hand total, locate safe logs by request ID, corrupt one fictional derived value, rebuild it, and document how a whole-app restore would affect records after the saved point.

Decisions that change the build

Should the first dashboard read live records or a derived snapshot?

  • Query the authoritative records when the user opens or filters the dashboard
  • Read a precomputed summary refreshed by a scheduled or background job

Choose: Start with a live server query for a bounded record set when it meets the response target. Move only expensive, measured aggregations to a versioned derived snapshot with explicit freshness and reconciliation.

Tradeoff: Live queries reduce stale-state complexity but can become slow or costly. Derived summaries improve predictable reads but introduce lag, rebuilds, definition versions, partial failure, and another result that must be reconciled.
Should a time-window metric use event time or ingestion time?

  • Use when the business event actually happened
  • Use when the record reached the dashboard data path

Choose: Use event time for business meaning and retain ingestion time for freshness, delay, and retry diagnosis. Publish the chosen window boundaries and time zone.

Tradeoff: Event time keeps the business period meaningful but late records can revise historical results. Ingestion time is operationally simple but can place the same real event in the wrong reporting period.

Should missing values display as zero?

  • Render zero when the metric is valid and no qualifying records exist
  • Render unknown or unavailable when the source or denominator is missing

Choose: Reserve zero for a valid calculation that found no qualifying value. Show unknown, unavailable, or stale when the system cannot calculate the metric honestly.

Tradeoff: Zero is visually simple, but using it for missing data hides ingestion and query failures. An explicit null state needs more interface copy but protects decisions from false certainty.

Before you share it

Test checklist

  • Happy path

    Load a fictional service-request fixture whose open count, resolved-this-week count, response-time median, daily buckets, and owner rows were calculated by hand for one named time zone.

    Expected: Cards, chart, table, metric definitions, and protected drill-downs match the hand calculation, persist across refresh, and report the same query version and successful freshness time.

  • Invalid input

    Send an unknown time zone, inverted or oversized date window, unauthorized team filter, malformed source record, and direct summary, drill-down, detail, export, definition-edit, and refresh requests from another account.

    Expected: The server rejects invalid and unauthorized input without partial source writes, leaked counts or row fields, cache pollution, or a misleading freshness update.

  • Duplicate or retry

    Submit the same source identity twice, retry one summary rebuild after an interrupted response, then ingest a legitimate late event for a previously displayed period.

    Expected: The technical retry remains one source event and one derived build, while the distinct late event updates the correct event-time period and advances freshness with an attributable reconciliation change.

  • Published smoke test

    Use a private mobile-width browser and two fictional ordinary accounts on the published HTTPS URL to load, filter, drill down, refresh, deny cross-account access, and compare one metric with its source rows.

    Expected: The authorized account sees matching views and a truthful freshness state, the other account receives no protected values, safe logs identify the query, and a forced failure preserves the last successful result as visibly stale.

If something goes wrong

Common failure cases

A metric card does not match its chart, table, or drill-down total

Likely cause
The views use different definitions, filters, window boundaries, time zones, query versions, or null and cancellation rules.
Check
Capture the actor scope, metric ID, definition version, query version, filters, window, time zone, returned source IDs, and each view total for the same request.
Fix
Return every view from one server query contract, remove duplicate browser calculations, and add the disagreement as a permanent reconciliation fixture.

The dashboard says “updated now,” but the values are old

Likely cause
The interface timestamp tracks page render, cache read, or rebuild start instead of the last successful data result and covered-through event time.
Check
Compare display time with query completion, source-through time, ingestion delay, cache version, rebuild status, and the latest accepted source record.
Fix
Advance freshness only after a successful calculation, show source-through and stale state explicitly, and keep the last successful result marked stale when refresh fails.

Counts double after an import, webhook retry, or refresh job retry

Likely cause
The same technical event or derived-build attempt received a new identity, or durable uniqueness was not enforced at the write boundary.
Check
Compare source IDs, provider event IDs, idempotency keys, query versions, job identities, ingestion timestamps, and the exact records included in the changed total.
Fix
Reuse one stable technical identity for the same attempt, enforce it durably, return the existing safe result on retry, and rebuild only the affected derived period.

A past reporting period changes without explanation

Likely cause
A legitimate late event arrived, the metric definition changed, or a canceled, corrected, or duplicate record was reclassified without visible version context.
Check
Compare event and ingestion times, source-record history, metric definition version, query version, correction reason, and before-and-after source ID sets.
Fix
Keep event and ingestion time, version definitions, publish a bounded revision reason, and rerun reconciliation for only the affected windows.

One user can reveal another team’s metric or detail rows

Likely cause
The server trusted a browser team filter or authorized the summary route without applying the same record scope to drill-down, detail, export, or cache keys.
Check
Replay summary, filter, chart, drill-down, detail, export, and refresh requests as signed out, two ordinary accounts, a team lead, and an administrator; inspect cache keys for actor scope.
Fix
Resolve allowed scope on every server action, intersect requested filters with it, include authorization scope in cache isolation, and repeat the cross-account matrix.

Recovery restores the dashboard but removes recent legitimate records

Likely cause
A whole-app saved-point restore was used for a bounded metric or summary problem, returning the database to an earlier state.
Check
Compare the saved-point time with source-record versions, event and ingestion times, authorized exports, query versions, and any post-checkpoint corrections.
Fix
Repair the bounded source record or rebuild the derived summary first, and review authorized post-checkpoint data before a whole-app restore when the situation permits.
Picture a decision-ready operations view

One Primary Count, a Trend, and Source Rows Can Explain the Same Story

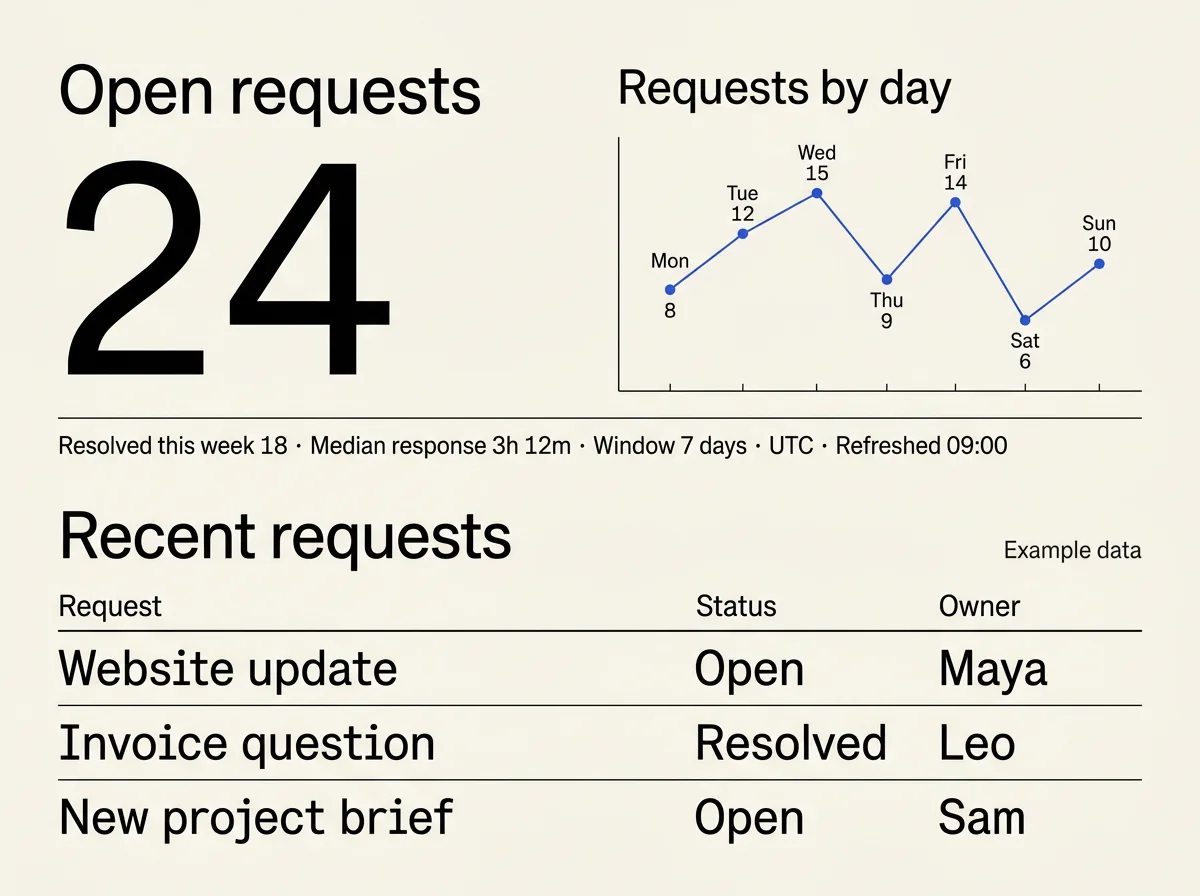
The example gives the main decision one clear focal point, then backs it with a weekly trend, recent requests, and an explicit freshness timestamp.

Illustrative service operations dashboard with a fictional open-request count, weekly trend, recent request rows, and an example-data note
Illustrative conceptIllustrative dashboard concept with fictional example values, not a Playcode product screenshot or performance proof. The actual result depends on your metric definitions, records, roles, data sources, and brief.
One correctness model, different operating questions

Custom Dashboards for Workflows With Specific Definitions

Change the records and metrics without weakening freshness or access boundaries

Service Operations

Backlog and response windows in context

Track requests by lifecycle, owner, service window, response time, exception reason, and source-through time with protected request details.

Order Fulfillment

Backlog and late work explained

Define placed, accepted, packed, shipped, canceled, and late states before showing order volume, aging, fulfillment time, and exception rows.

Project Delivery

Risks tied to real work items

Show work in progress, blocked items, due windows, ownership, and change history with a drill-down that preserves project and team access.

Membership Operations

Lifecycle counts without hidden assumptions

Separate invited, active, expired, revoked, and pending-renewal records, then make every summary traceable to the permissioned member rows.

Define what working means

Prove One Decision Loop Before Adding More Charts

A useful first release keeps metric meaning, source records, query results, access, freshness, and recovery consistent from summary to drill-down.

1 contract
cards, charts, tables, and drill-downs share the same metric definition
2 clocks
event time explains the business period; ingestion time explains freshness
4 tests
valid, invalid, repeated or late, and published behavior
Choose the right amount of customization

Spreadsheet, Packaged BI, or a Custom Dashboard?

Use the smallest maintained system that can represent your sources, definitions, access, and operating responsibility.

Team needSpreadsheet or packaged BIPlaycode-built dashboard
A small trusted team reviews a simple totalA spreadsheet may be the quickest and clearest maintained choiceBuild only when repeatable access, drill-down, or workflow rules justify it
Standard connectors and common analytics models fitA packaged BI tool may provide the faster supported pathUseful when the source and decision workflow are custom and bounded
Metric definitions and permissions are business-specificMay require plan-specific modeling, roles, or workaroundsDefine the exact records, formulas, scopes, screens, and drill-down actions
Freshness, late data, and retries need explicit behaviorBehavior depends on the selected source, connector, and configurationMake event time, ingestion time, idempotency, staleness, and rebuilds explicit
The team owns operation and recoveryUse the provider refresh, export, support, and recovery contractOperate the custom query, cache, safe logs, record export, and recovery runbook
The engine

A software team in one agent

Playcode AI runs the same frontier models that power ChatGPT and Claude - and orchestrates them like a team: it plans the work, delegates to sub-agents, runs long jobs in the background, and reviews its own changes.

Every frontier model

The latest models from every major lab, in one picker. Switch anytime.

ClaudeGPTGeminiGrok

Sub-agents

Big jobs split across specialists - one explores your code, one writes, one audits - working in parallel.

Background tasks

Long builds and migrations keep running while you keep talking. They report back when done.

migration - running

It sees your designs

Have a design in Figma? Paste a screenshot - or a page you like, or a bug - and it builds from what it sees.

Tuned by years of iteration to write production software - structured, typed, maintainable - not throwaway prototypes.

Production code

Real code you can open, read, and edit

Under every project is a codebase the agent keeps production-grade. And you are never locked out of it: open the file explorer and edit any file yourself - server included. No AI required.

Quality is the default

Complete states, secure boundaries, structured code - the bar is what a professional agency would ship.

Every file is yours to open

Browse the whole project - frontend, backend, configuration - and edit directly in the built-in editor.

Developers are welcome

Invite your developer with the right role, or export the project code and files. Nothing is trapped in Playcode.

For teams and organizations

Share it like you share a doc

Playcode is built for organizations, not just solo builders. Workspaces hold your projects, people, and billing; roles and teams decide exactly who sees what.

Workspaces with their own billing

Create a workspace per company, client, or department - each with its own members, projects, and subscription.

Three clear roles

Admins manage, editors build, viewers watch. Set roles on the whole workspace, on a team, or on a single project.

Teams that scope access

Group people into teams and give each team its own projects - or a whole folder of them. Private projects stay private, even inside a shared workspace.

Share outside the workspace

Send a project to any email - a client, a contractor - with exactly the access you choose. No extra seat needed.

Share "Inventory tracker"
Acme Ops workspace
Private
client@partner.co
Editor Invite
Operations team
8 people
Editor
MK
Maya Kowalski
maya@acme.co
ADMIN
JR
Jon Reyes
jon@acme.co
EDITOR
LS
Lena Sato
lena@acme.co
VIEWER
Restricted - only people invited can open it
Real-time

Multiplayer by default

Work on one project together. Write in the same AI chat together. Every message, edit, and setting is fully synchronized - live, for everyone, on every device.

acme-launch · Playcode
MKJR
Maya's laptop
Maya
Add a 'Book a call' button to the hero
Jon
And link it to our calendar, please
Playcode AIDone - button added to the hero and linked to your calendar.Preview updated
Describe the next change...
Jon's phone
Maya
Add a 'Book a call' button to the hero
Jon
And link it to our calendar, please
Playcode AIDone - button added to the hero and linked to your calendar.
Message...
Already there. No refresh.

Same project, same moment

Everyone works in the project at the same time - even in the code editor - without lock-outs or "who has the latest version".

Every device

Start on the laptop, check from your phone: the same live state follows you everywhere you sign in.

Nothing to refresh

Changes arrive over a live connection the instant they happen. Reloading the page is a habit you can drop.

Feels instant

It never makes you wait

Instant

Every click applies immediately on your device. Syncing happens behind you, not in front of you.

Offline

Connection dropped? Your changes queue locally and replay the moment you are back.

Reload-proof

The queue survives closing the tab. Nothing you did is lost while you are away.

Real People. Real Websites Built with AI.

"I built my entire portfolio site in 20 minutes. My clients think I hired a designer. Already got 3 new inquiries this month."
Marcus T. · Freelance Graphic Designer, Austin TX
"We switched from Wix to Playcode. The AI actually understands what we need instead of giving us cookie-cutter templates. Saved us thousands."
Sarah Chen · Owner, Bloom & Petal Floristry
"I update my property listings from my phone while showing apartments. Clients are impressed when I tell them I built the site myself."
David Morales · Real Estate Agent, Miami FL

Simple Pricing

Start small. Upgrade when you're ready.

Starter

$0to start

Try the AI website builder and see results

  • AI credits included to start
  • Publish your site instantly
  • Subdomain included
  • Website hosting included
  • No credit card required
Get Started

Pro

Most Popular
$21/month

Everything you need to build

  • 100 AI credits/month
  • All AI models (12+)
  • Visual editing
  • Custom domains
  • Website hosting included
  • Export your code anytime
  • Private projects
  • Unlimited collaborators

Cancel anytime. No hidden fees.

How credits work

Credits are used when AI helps you. Simple edits cost less, complex features cost more.

  • "Change button color" ~0.3-0.5 credits
  • "Add a contact page" ~2-3 credits
  • "Build full landing page" ~5-10 credits

Most users never run out. 100 credits = lots of building.

Questions to Ask Before Choosing an AI Dashboard Builder

Yes. Describe the source records, metric definitions, filters, roles, and decisions you need. Playcode can build the browser interface, server query, and database-backed workflow. Your team still needs to approve the definitions, supply or model the data path, test access, reconcile the numbers, and operate the published app.

No. Playcode is an AI app builder that can create a custom dashboard as real code. This page does not claim a packaged BI service, native warehouse, automatic analytics connector, prebuilt semantic layer, autonomous business analysis, or a reproduced public dashboard demo.

Name the business question, numerator, denominator when applicable, exclusions, grouping, window boundaries, time zone, event timestamp, source records or query, display format, null and zero behavior, late-data rule, definition version, and owner who resolves disagreements. Keep that definition visible near the metric or in a protected definitions view.

Start with a live authorized query when the bounded record set meets the response target. Use a derived summary only for measured expensive work. Store its definition version, source-through time, successful calculation time, and rebuild identity. Reconcile it with the authoritative records and show stale state when refresh fails.

Use zero only when a valid calculation finds no qualifying value. Show unknown or unavailable when source data is missing, and stale when the last successful result is older than its contract. Keep event and ingestion time so a legitimate late record updates the correct business period with a traceable revision.

Enforce current workspace membership, role, team, record scope, and requested action on every server summary, filter, chart, drill-down, detail, export, definition-edit, and refresh path. Include authorization scope in cache isolation. Test signed out, two ordinary accounts, the intended lead, and an administrator. Hidden charts are not authorization.

It can use an external source when a current API, database, file, webhook, or supported import path exists. That requires the provider account, plan, least-privilege server-side credentials, field mapping, rate-limit and retry handling, rotation, revocation, and tests. This page does not claim any native or one-click provider integration.

Treat source-code export, authorized source-record export, derived dashboard export, summary rebuild, record repair, and whole-app recovery as separate contracts. A whole-app restore returns code, files, and database to a saved point, so legitimate records after that point can also move backward. Prefer bounded repair when the damage is bounded.

Still have questions? Contact us

Build the dashboard around one decision your team can verify.

Describe the records, metric definitions, roles, and drill-down. Reconcile the complete view before adding another chart.

A service dashboard with open requests, weekly resolutions, response time, and owner drill-downs...Build My Dashboard

No credit card required. AI credits included.